

Background:
Vehicle Anomaly Detection Dashboard (EVAP-PURGE) is a tool providing critical data visualizations, filters, and downloadable datasets derived from complex anomaly detection algorithms.
Pain Points:
-
The dashboard faced usability challenges and user adoption issues.
-
As a secondary product, resources were limited.
Solution:
-
Optimized redesign as per user feedback.
-
Enhancing user communication channels.
-
Established ways to reduce Tech/Design debt.
Duration:
5 Months
My Role:
UX Researcher: Conducted user interviews, usability testing, heuristic evaluations, and product research to identify and address user pain points.
Success:
-
Reduced primary task completion time by 60 seconds on average.
-
Requests for user support through chat/email were reduced significantly.
*To comply with my non-disclosure agreement, I have obfuscated & redacted confidential information in this case study.
Challenges
Dashboard Tool Limitations (QlikSense):
-
The chosen dashboarding tool, QlikSense, imposed constraints on layout and visual design, hindering optimal user experience.
Dashboard Clutter:
-
Lack of initial user research resulted in a cluttered interface with non-essential features and underutilized filters, impacting efficiency.
Communication Barriers:
-
The complex nature of anomaly detection algorithms and the technical jargon used by feature system engineers posed challenges in effective communication and requirements gathering.
"Super User" Support Demands:
-
The EVAP-PURGE core team, a key user group, required extensive 1:1 support, leading to developer time constraints.
Accumulating Technical and Design Debt:
-
Ad-hoc updates based on scattered user feedback led to technical and design inconsistencies, creating a backlog of issues.
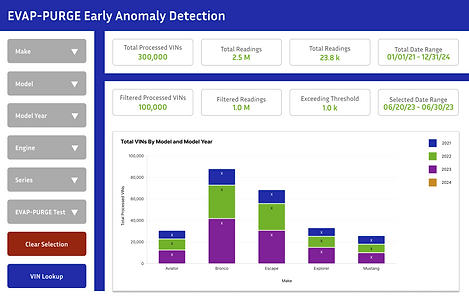
Fig. Dashboard is cluttered due to lack of user research and QlikSense tool limitations

Fig. The 'Super user' persona needs extensive support.
Solutions and Impact

Fig. One of the card-sorting sessions to extract insights from user data.
Addressing Dashboard Tool Limitations:
-
Solution: Conducted extensive usability testing (20+ users) to optimize user flow and prioritize essential features. Leveraged design sensibility within the tool's constraints to improve visual clarity.
-
Impact: Improved user efficiency by highlighting critical readings and frequently used anomaly detection test filters, maximizing the tool's potential within its limitations.

Fig. Strategically placed frequently needed anomaly detection readings and test filters.
Reducing Dashboard Clutter:
-
Solution: Conducted targeted usability tests to identify underutilized features and filters. Analyzed backend usage data to pinpoint "super users" and their usage patterns.
-
Advocated for the removal of redundant or lightly used elements. E.g. VIN Lookup content was moved to a secondary page.
-
Impact: Streamlined the dashboard, improved information accessibility, and reduced cognitive load for users.

Fig. VIN Look up content was not used by primary persona
Enhancing User Communication:
-
Solution: Shadowed a developer to gain a deeper understanding of the anomaly detection algorithms. Regularly attended development team meetings to acquire domain knowledge.
-
Impact: Facilitated more effective user interviews and requirement gathering, leading to solutions that better aligned with user needs.
Optimizing "Super User" Support:
-
Solution: Implemented regular "office hours" to provide dedicated support and address user queries proactively. Conducted demos for stakeholders and the "super user" team following major updates.
-
Impact: Reduced 1:1 support requests, improved user satisfaction, and fostered a more collaborative relationship with key user groups.

Fig. Effort vs Impact analysis to make decision on support methods.
Managing Technical and Design Debt:
-
Solution: Established a structured user feedback funnel (excel sheet), centralizing input from various channels (interviews, usability tests, email, chat, office hours). Implemented a triaging system (red, orange, yellow) to prioritize issues in collaboration with the product owner, PM, and tech lead.
-
Impact: Created a transparent and manageable backlog, enabling the team to address critical issues systematically and prevent further accumulation of debt.

Fig. Image for representation purpose only.
Key Learnings
-
The importance of early and continuous user research, even for secondary products.
-
The value of cross-functional collaboration and domain knowledge acquisition.
-
The effectiveness of structured feedback mechanisms in managing technical and design debt.
-
The profound positive impact that dedicated office hours can provide for power users.
KPI
-
Reduced primary task completion time by 60 seconds on average.
-
Requests for user support through chat/email were reduced significantly.